Control valve lifecycle cost is the total economic effect of selecting, operating, maintaining, and eventually replacing a valve assembly. Purchase price matters, but energy loss, process variability, maintenance labor, spares, utilities, downtime, emissions, obsolescence, and documentation can outweigh the initial difference.
A credible control valve lifecycle cost comparison uses the same service duty, time horizon, currency basis, discounting method, operating hours, and risk scenarios for every option. It separates measured data from assumptions and shows which inputs drive the result.
This guide helps engineering, maintenance, operations, and procurement teams build a practical control valve lifecycle cost model without inventing failure rates, energy savings, or return-on-investment claims.
Table of Contents
Define the Cost Boundary Before Comparing Valves

For control valve lifecycle cost, state whether the analysis covers the valve body, trim, actuator, accessories, installation, commissioning, utilities, maintenance, spares, process effects, downtime, and disposal. Define the study period and whether taxes, escalation, and discounting are included.
For control valve lifecycle cost, compare options that meet the same functional requirement. A cheaper valve that lacks required capacity, leakage performance, response, materials, or documentation is not an economic alternative.
Identify the decision owner and data sources. Finance may define discounting, operations may value downtime, maintenance may estimate labor, and engineering may calculate energy and hydraulic performance.
Purchase Price Is Only the Initial Cash Event

Control valve lifecycle cost begins with the valve, actuator, positioner, accessories, testing, documents, freight, inspection, spares, special tools, site modifications, installation, and commissioning. Scope differences should be normalized before comparing quotations.
A control valve lifecycle cost model should capture engineering and site work created by omitted brackets, tubing, reducers, supports, cables, air sets, or tests. The lowest purchase order can become expensive if missing interfaces appear during construction.
Use the control valve RFQ guide to align supplier scope and deviations.
Pressure Loss Creates a Recurring Energy Load
For control valve lifecycle cost, a throttling valve dissipates pressure. When the system creates more pressure than the process needs, pumps or compressors supply energy that is then lost across the valve. Valve sizing, line size, pump control, and operating travel influence that loss.
For control valve lifecycle cost, calculate flow multiplied by pressure loss using consistent units and actual operating hours for representative load cases. Include pump or compressor efficiency and energy tariff assumptions defined by the project.
Do not claim energy savings by reducing valve pressure drop unless the upstream system can reduce generated head or compression. US Department of Energy pumping-system resources provide useful system context.
Poor Control Can Create Process Cost

Oversizing, stiction, deadband, poor positioner setup, unstable pressure drop, or an unsuitable characteristic can increase process variability. The economic effect may appear as off-spec product, excess utilities, reduced throughput, alarms, or operator intervention.
Control valve lifecycle cost should include process-performance effects only when the organization has a defensible relationship between valve behavior and the business outcome. Avoid converting every deviation into a speculative monetary claim.
Use measured trends, controlled tests, and the control valve stiction guide to identify mechanical versus process causes.
Maintenance Cost Depends on Access and Failure Mode
Control valve lifecycle cost includes maintenance for inspection, diagnostics, isolation, decontamination, scaffolding, lifting, removal, workshop labor, parts, calibration, testing, installation, and recommissioning. Access and modularity can matter as much as part price.
For control valve lifecycle cost, estimate planned and corrective tasks separately. Use plant history for similar service, not a universal maintenance interval. Include travel and specialist support where local capability is limited.
The control valve maintenance guide helps define task content and evidence.
Downtime Risk Needs Scenario Analysis
Control valve lifecycle cost downtime scenarios should reflect redundancy, bypass, unit turndown, repair access, spare availability, and restart sequence. A valve failure may stop a unit, reduce production, or have little immediate effect depending on the process.
A control valve lifecycle cost analysis can use expected-value scenarios only when probabilities and consequences are supported. Otherwise present separate low, central, and high cases and show the decision sensitivity.
Do not hide safety or environmental requirements inside a financial tradeoff. Mandatory risk controls remain constraints, not optional costs.
Spares and Obsolescence Affect Long-Term Support
Control valve lifecycle cost accounts for spares that create carrying cost, preservation work, shelf-life risk, and capital tied in inventory, but they can reduce repair time. Unique long-lead trim or electronics may require a different strategy from common soft parts.
For control valve lifecycle cost, include commissioning spares, operating spares, insurance spares, obsolescence risk, firmware support, special tools, and repair turnaround.
Use the control valve spare-parts guide and update the model when lead time or installed population changes.
Utilities and Emissions Belong in the Model
Instrument air consumption, electric power, hydraulic power, purge gas, flushing fluid, cooling, heat tracing, and leak-monitoring systems add operating cost. Packing or seat leakage can also waste process fluid or increase emissions-control load.
Control valve lifecycle cost should use measured or supplier-documented utility demand under realistic cycling, not maximum nameplate consumption applied to every hour.
Environmental cost must follow the plant’s approved accounting and legal framework. Fugitive-emission background is available from US EPA equipment leak guidance.
Lifecycle Cost Comparison Worksheet
| Cost element | Required input | Common error |
|---|---|---|
| Initial scope | Normalized equipment, tests, documents, installation | Comparing incomplete quotations |
| Energy | Flow, pressure loss, efficiency, hours, tariff | Assuming valve loss can always be recovered |
| Maintenance | Task labor, parts, access, interval, test | Ignoring isolation and recommissioning |
| Downtime | Scenario duration, production effect, redundancy | Using unsupported failure probabilities |
| Spares and support | Population, lead time, shelf life, obsolescence | Stocking by valve size alone |
| Utilities and emissions | Measured demand, cycling, leakage basis | Applying nameplate maximum continuously |
Use the worksheet to make every control valve lifecycle cost assumption visible. The purpose is decision support, not a falsely precise single number.
Use Sensitivity Analysis Instead of False Precision
Vary the inputs most likely to change the decision: operating hours, energy price, pressure drop, maintenance interval, labor, spare lead time, outage duration, and discount rate. Present the break-even point where one option becomes preferable.
A control valve lifecycle cost sensitivity chart is more useful than adding decimal places to uncertain data. Separate controllable design variables from external business assumptions.
Economic-analysis background is available from NIST life-cycle costing resources. Asset-management principles can be informed by ISO 55001 information. Financial methods should follow the company’s approved policy.
Collect Evidence After Installation
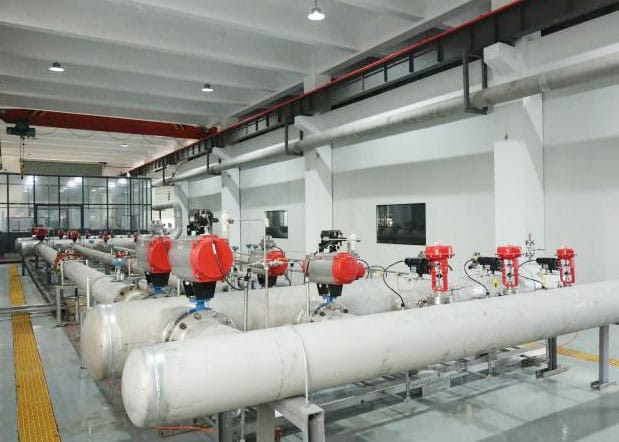
After installation, collect valve travel, pressure drop, actuator demand, diagnostics, maintenance labor, parts, failure mode, outage time, utilities, and removed-component condition. Compare actual values with the business-case assumptions.
Control valve lifecycle cost should become a learning system. Update standard specifications, preferred configurations, spare quantities, and maintenance intervals when evidence changes.
Preserve the final datasheet, calculations, test records, configuration, and bills of material so cost and reliability data can be linked to the exact assembly.
Frequently Asked Questions
Is the lowest purchase price usually the lowest lifecycle cost?
Not necessarily. Scope gaps, energy loss, maintenance access, spares, downtime, and process performance can change the outcome. Normalize requirements before comparison.
How should downtime cost be estimated?
Use plant-approved scenarios based on redundancy, lost or reduced production, repair duration, restart, and credible consequences. Show uncertainty instead of inventing precision.
Can a larger valve reduce energy cost?
It may reduce valve pressure loss, but an oversized valve can harm control. Energy is saved only if the pump or compressor system can reduce generated head or power.
Which time horizon should be used?
Use the organization’s asset and financial planning horizon, with consistent discounting and replacement assumptions across all alternatives.
What evidence improves future estimates?
Track operating travel, pressure drop, utility demand, diagnostics, maintenance hours, parts, failure mechanism, outage duration, and actual service life.
Select the Lowest Defensible Total Cost
A defensible control valve lifecycle cost decision compares technically compliant options on a common boundary and makes energy, maintenance, downtime, spares, utility, and uncertainty assumptions transparent.
Provide Phileda with the process duty, quotations, operating profile, maintenance strategy, utilities, criticality, and required analysis boundary through the contact page for a structured comparison.