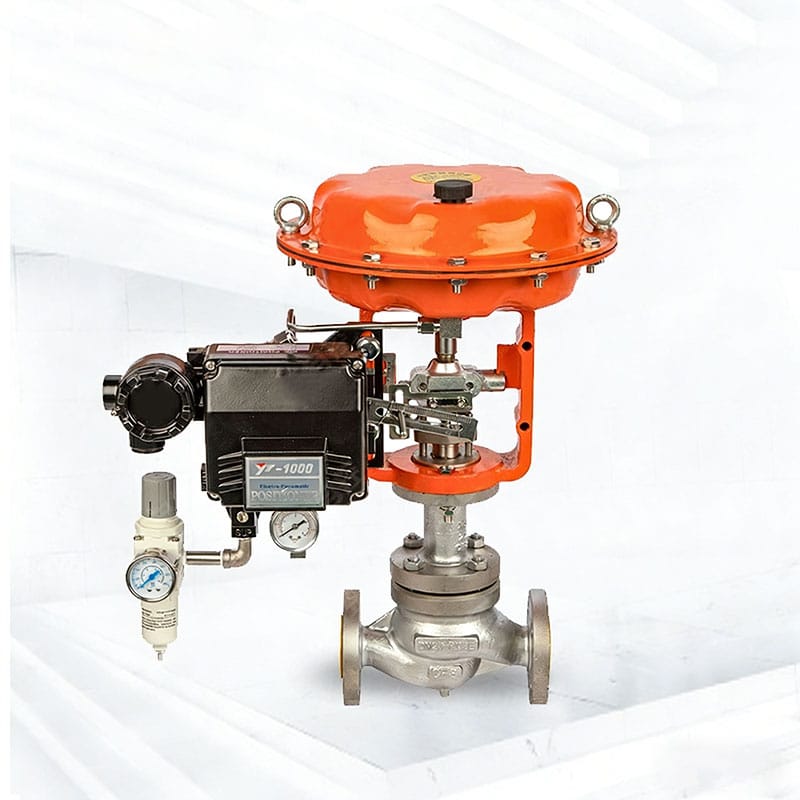
A control valve can respond correctly to its signal and still be destroying itself from the inside. When a liquid crosses a severe pressure drop, its local pressure may fall below its vapor pressure and create vapor bubbles. What happens next determines whether the problem is control valve cavitation or flashing—and the correct solution is different for each condition.
The quick distinction is simple: if pressure recovers above the liquid’s vapor pressure, the bubbles collapse and control valve cavitation occurs. If downstream pressure remains at or below vapor pressure, the vapor survives downstream and the liquid is flashing. Both conditions can limit capacity, create noise and vibration, and shorten equipment life, but only one is solved by preventing bubble collapse inside the valve.
This guide shows how to read the pressure profile, distinguish the damage patterns, diagnose the operating case, and select a practical mitigation strategy before replacing another trim set.
Key takeaways
- Control valve cavitation begins when the minimum local pressure falls below vapor pressure and ends with bubbles collapsing after pressure recovery.
- Flashing begins the same way, but the vapor remains because downstream pressure does not recover above vapor pressure.
- Sound is a warning, not a diagnosis. Use pressure, temperature, fluid properties, valve opening, flow, and inspection evidence together.
- A correct flow coefficient does not automatically mean the valve is safe from control valve cavitation, flashing, excessive velocity, or noise.
- The best solution first changes the pressure profile; materials are the final defense against damage that cannot be eliminated.
Table of Contents
Why Control Valve Cavitation Is a System Problem
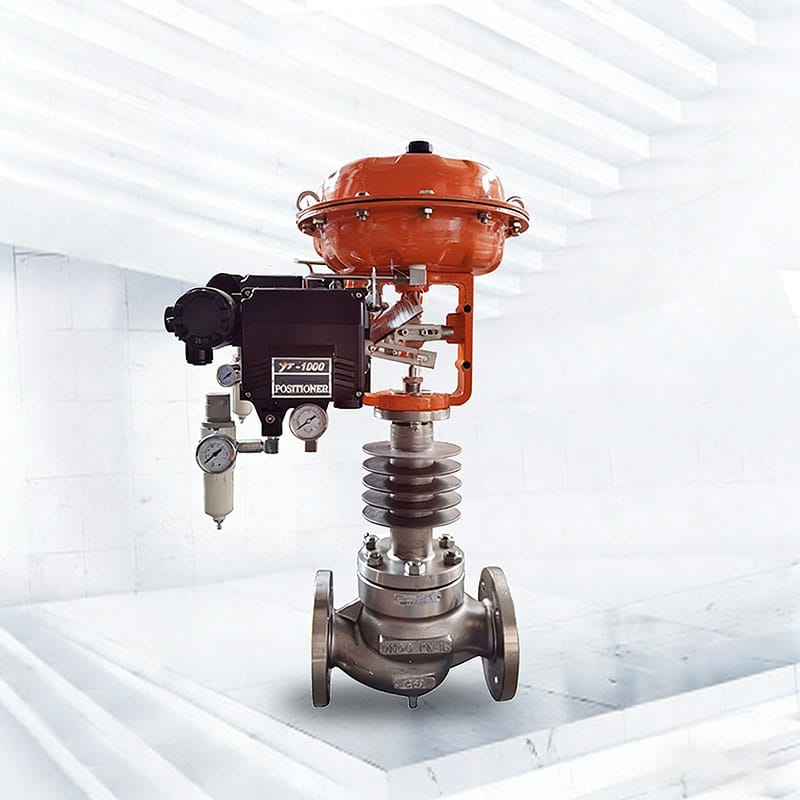
It is tempting to treat control valve cavitation as a trim-material failure. In reality, the valve is where the system dissipates energy, so it is often where a process-design problem becomes visible. Upstream pressure, downstream pressure, liquid temperature, vapor pressure, flow rate, piping geometry, valve recovery characteristics, and valve travel all influence the result.
That distinction matters because replacing damaged parts without changing the energy profile often resets the failure clock. A harder surface may last longer, but it does not stop vapor bubbles from forming. A larger valve may pass more flow, but it can force normal operation close to the seat, reduce control resolution, and concentrate the pressure drop through a small opening.
The consequences extend beyond the valve:
- Pitting can change the plug, seat, or ball geometry and increase shutoff leakage.
- Vibration can loosen packing, tubing, fasteners, instruments, and nearby pipe supports.
- Unstable two-phase flow can disturb the control loop and make a healthy actuator appear faulty.
- Eroded downstream piping can become the weakest pressure boundary.
- High process noise can become an occupational exposure issue that deserves a proper assessment under applicable guidance such as the OSHA occupational-noise resources.
For that reason, the first question should not be “Which harder trim should we buy?” It should be “Where does the liquid cross its vapor-pressure boundary, and where does it return?”
The Pressure Profile Inside a Liquid Control Valve
Upstream and downstream gauges do not show the lowest pressure inside a valve. As liquid accelerates through the most restricted flow area, static pressure falls. The minimum pressure normally occurs near the vena contracta, just downstream of the restriction. Farther downstream, velocity decreases and part of the pressure recovers.
Four pressures or conditions are central to a diagnosis:
- P1: valve-inlet pressure under the operating case.
- Pvc: minimum local pressure near the vena contracta; it is generally lower than the measured outlet pressure.
- P2: recovered pressure downstream of the valve.
- Pv: vapor pressure of the actual liquid mixture at its actual operating temperature.
The simplified pressure logic is:
| Flow condition | Minimum local pressure | Recovered downstream pressure | What happens |
|---|---|---|---|
| Single-phase liquid | Pvc stays above Pv | P2 stays above Pv | No vapor bubbles form |
| Cavitating liquid | Pvc falls below Pv | P2 recovers above Pv | Bubbles form, then collapse |
| Flashing liquid | Pvc falls below Pv | P2 remains at or below Pv | Vapor forms and persists downstream |
This is a diagnostic model, not a substitute for formal sizing. Real calculations also depend on fluid properties, valve geometry, pressure-recovery factors, attached fittings, and the operating point. Use absolute pressure consistently when comparing process pressure with vapor pressure, and never reuse vapor-pressure data from a different temperature or composition.
For formal liquid-flow capacity work, consult the applicable industrial control valve sizing equations, use a recognized control valve cavitation evaluation practice, and verify the result with valve-specific data. Phileda’s control valve sizing guide provides a practical overview of the process information needed before selection.
What Happens During Control Valve Cavitation
The physical sequence behind control valve cavitation has four stages:
- Acceleration: Liquid speeds up as the available flow area narrows.
- Local vaporization: Static pressure near the vena contracta drops below Pv, creating vapor cavities even though the bulk liquid is not boiling upstream.
- Pressure recovery: The flow area expands downstream, velocity decreases, and local pressure rises.
- Collapse: When recovered pressure exceeds Pv, vapor bubbles implode. Repeated collapse near a solid surface produces localized shock loading and microjets that fatigue and remove material.
This explains why control valve cavitation damage is usually irregular and deeply pitted rather than uniformly polished. Severe cases may attack the plug, seat ring, cage, body wall, or downstream pipe. The damage location depends on the flow path and where pressure recovery causes the vapor cavities to collapse.
The broader physics of cavitation and cavitation erosion also appears in pumps, propellers, and turbines. In a throttling valve, however, the decisive engineering variables are the installed pressure drop, the valve’s pressure-recovery behavior, and the liquid’s vapor pressure at each real operating condition.
How Flashing Starts the Same Way but Ends Differently
Flashing also begins when local liquid pressure drops below vapor pressure. The difference is downstream: P2 does not recover above Pv, so at least part of the fluid remains vapor. There is no widespread bubble-collapse zone to eliminate inside the valve because the phase change continues into the outlet and downstream pipe.
That does not make flashing harmless. A high-velocity two-phase mixture can erode metal through droplet impact, directional impingement, and sustained shear. Damage may extend through the valve outlet, reducer, elbow, and downstream line. The surface often looks smoother and more directional than the crater-like pitting associated with control valve cavitation, although field evidence is not always textbook-clean.
The engineering objective also changes. For control valve cavitation, the goal is often to keep pressure above Pv or manage recovery so collapse occurs away from vulnerable surfaces. For flashing, the goal is to control velocity, choose an appropriate flow path and outlet geometry, resist erosion, and design the downstream piping for persistent two-phase flow.
Control Valve Cavitation vs Flashing at a Glance
| Question | Control valve cavitation | Flashing |
| What initiates it? | Local pressure falls below liquid vapor pressure | Local pressure falls below liquid vapor pressure |
| What is P2 relative to Pv? | P2 recovers above Pv | P2 stays at or below Pv |
| What happens to vapor bubbles? | They collapse after pressure recovery | They remain in the downstream flow |
| Typical sound clue | Intermittent crackling, rattling, or “gravel” noise | More continuous hiss or rushing sound |
| Typical damage clue | Rough, cratered, localized pitting | Smoother, directional erosion and thinning |
| Common damage area | Trim and pressure-recovery zone; sometimes body or pipe | Outlet region and downstream piping as well as trim |
| Primary mitigation objective | Prevent vapor formation, stage pressure reduction, or control where collapse occurs | Manage two-phase velocity and direct erosive flow away from vulnerable surfaces |
| Role of hard materials | Secondary protection after pressure-profile improvements | Erosion resistance is often important but still does not correct poor geometry or excessive velocity |
Noise and appearance are useful clues, but neither proves the condition alone. A cavitating valve can produce a steady broadband sound, and flashing damage can coexist with corrosion or solids erosion. The pressure-temperature analysis must lead; the inspection pattern should confirm it.
How to Diagnose Control Valve Cavitation in the Field
Reliable diagnosis combines three types of evidence: operating data, condition monitoring, and physical inspection. Avoid changing several variables at once; a controlled comparison makes the root cause easier to isolate.
Start with synchronized process data
Trend P1, P2, flow, fluid temperature, valve command, actual valve travel, and any available vibration or acoustic data on the same time axis. Record normal, minimum, maximum, startup, shutdown, and upset cases. A single datasheet value can hide the exact condition that triggers control valve cavitation.
Look for correlations:
- Does noise begin when differential pressure rises?
- Does the event appear as fluid temperature increases and Pv rises?
- Does the valve spend long periods at very low travel?
- Does flow stop increasing even when the valve opens farther?
- Do position, flow, or downstream pressure oscillate together?
Correlations do not replace sizing, but they identify which operating cases must be calculated.
Treat sound and vibration as warning signals
Technicians often describe control valve cavitation as gravel moving through the valve. Flashing is more often described as a hiss. These descriptions are helpful for screening, but turbulence, choked flow, loose hardware, pipe resonance, and mechanical contact can sound similar.
Use repeatable measurements where possible. Compare acoustic or vibration trends at the same flow and valve position, use consistent sensor locations, and establish a baseline after commissioning or repair. Do not ask personnel to approach a noisy, vibrating valve without following the site’s safety procedures.
Map the damage instead of merely photographing it
During an outage, record the orientation and precise location of pitting or thinning on the trim, body, gasket faces, outlet, reducer, and first downstream elbow. Note the flow direction and valve installation orientation. Measure wall thickness where erosion is suspected.
Sharp, sponge-like pitting near a recovery zone supports control valve cavitation. Smooth, swept channels extending downstream support flashing or particle erosion. Damage on one side may indicate a concentrated jet, misalignment, an incorrect flow direction, or piping geometry that deflects the flow.
Why a Correct Cv Can Still Produce a Failed Valve
Cv answers an essential capacity question, but it does not answer every severe-service question. A valve can pass the required flow and still have unacceptable velocity, travel, noise, pressure recovery, control valve cavitation, or flashing behavior.
Common specification gaps include:
Only one operating point was sized
Plants rarely run at a single steady condition. Maximum flow may create the largest pressure drop, but a minimum-flow case can force a large valve close to the seat and create a concentrated high-velocity jet. Startup may combine colder or hotter fluid with a temporary downstream pressure that never occurs in normal production. Every credible case deserves separate evaluation.
The valve was oversized for “safety margin”
Adding excessive Cv margin can reduce usable travel and control resolution. If the valve normally throttles near closed, small stem or shaft movements create large percentage changes in flow area. Oversizing does not automatically cause control valve cavitation, but it can create an unfavorable operating point and make the loop less stable.
Vapor pressure was estimated incorrectly
Pv is temperature- and composition-dependent. Using water data for a process mixture, using a design temperature instead of the actual maximum temperature, or mixing gauge and absolute pressures can reverse the diagnosis. For blends, dissolved gases, or fluids near phase equilibrium, use reliable thermodynamic data and involve the process engineer. Where temperature also governs body, trim, packing, or actuator choices, review the high temperature control valve selection guide.
Valve recovery and fittings were ignored
Different flow paths recover pressure differently after the restriction. High-recovery geometries can reach a lower Pvc for the same measured P1 and P2. Reducers, expanders, and other attached fittings also change the installed behavior. Severe-service sizing must use the actual valve and piping configuration, not a generic Cv alone.
A Five-Level Strategy to Prevent Control Valve Cavitation
The most durable approach follows a hierarchy. Begin by changing the system energy condition, then refine valve geometry, then protect materials and monitor the residual risk.
1. Change the process pressure or temperature—when permitted
Possible system-level measures include increasing downstream backpressure, reducing inlet pressure, lowering liquid temperature, relocating the valve to a point with higher static pressure, or dividing the total pressure drop between suitable devices. Even a modest change can keep Pvc above Pv or reduce the intensity of control valve cavitation.
These changes affect pumps, vessels, relief scenarios, control authority, and production capacity. They require process and safety review; a downstream restriction should never be added solely to quiet a valve without checking the entire system.
2. Divide the pressure drop into stages
Multi-stage or multi-path trim replaces one large pressure reduction with several smaller reductions. The intent is to prevent the local pressure from crossing Pv at any stage, or to reduce the energy available when cavities collapse. Small passages can also become vulnerable to plugging, so fluid cleanliness and particle size must be included in the selection.
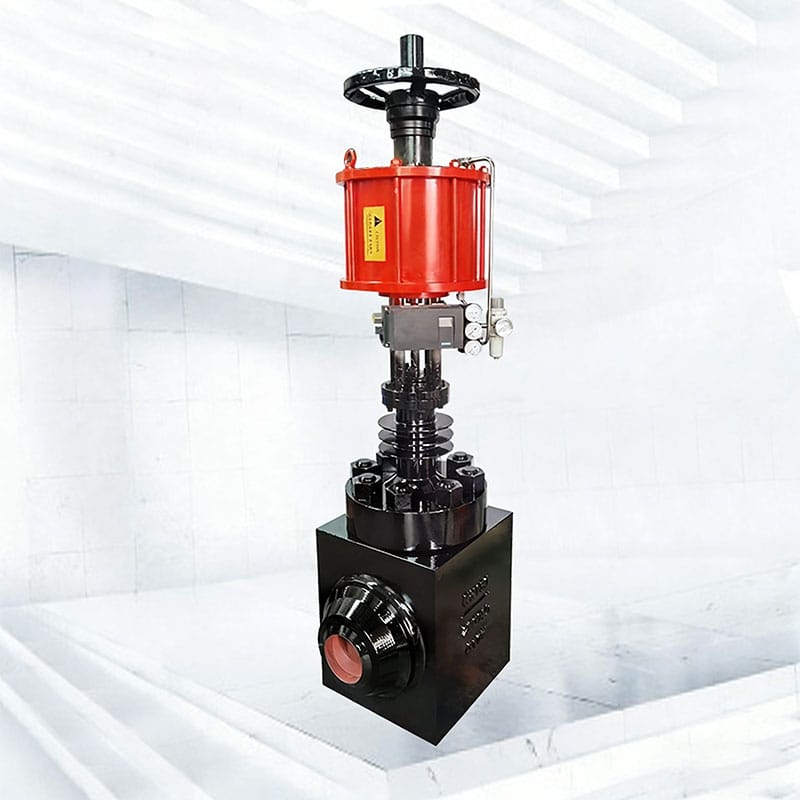
For high differential-pressure liquid duties, a purpose-selected pneumatic high pressure control valve or electric ultra high pressure control valve can provide an engineering starting point. Final trim geometry must still be sized against the complete operating envelope.
3. Control where pressure recovery and impingement occur
Some designs direct jets toward the center of the flow stream or move the main energy-dissipation zone away from pressure-retaining walls. Angle-body arrangements may simplify the flow path in suitable services, while enlarged outlets can help manage a flashing mixture. The correct flow direction is design-specific and must follow the selected valve’s documentation.
4. Select materials for the remaining damage mechanism
Hard-facing, hardened trim, and erosion-resistant materials can extend service life, but they should support—not replace—the pressure-management strategy. Material selection must also account for corrosion, temperature, galling, thermal cycling, and fluid compatibility.
Pressure-containing components should be specified against the project’s applicable code and pressure-temperature requirements, such as ASME B16.34 where relevant. Code compliance and control valve cavitation performance are separate checks; satisfying one does not prove the other.
5. Monitor the residual risk
After commissioning, capture a baseline for valve travel, loop behavior, noise, and vibration. Track changes under comparable operating conditions. If the service is critical, plan inspection intervals around observed degradation rather than waiting for leakage or loss of control.
This hierarchy turns control valve cavitation from a recurring repair into a managed engineering risk.
Choosing a Valve Architecture for Severe Liquid Service
No valve style universally prevents control valve cavitation. Selection depends on required Cv, pressure class, rangeability, fluid cleanliness, shutoff requirement, actuator response, allowable noise, and the location of the damaging pressure recovery.
| Valve architecture | Where it may fit | Questions to verify |
| Globe-style high-pressure control valve | Large pressure drops, precise throttling, and applications that may benefit from staged or guided trim | Can the selected trim keep each stage above Pv? Are passages compatible with solids? Is the actuator force adequate at every case? |
| V-port control ball valve | High capacity, broad modulation, and fluids where a rotary flow path is advantageous | What are the valve-specific recovery factor, velocity, travel, and control valve cavitation limits at minimum, normal, and maximum flow? |
| Eccentric rotary valve | Compact rotary control for suitable pressure, temperature, and media conditions | Where will the jet and recovery zone occur? Are shutoff, material, and dynamic-torque requirements met? |
| Angle-pattern severe-service valve | Services where changing flow direction and managing the outlet path are beneficial | Does the body orientation direct damaging flow away from vulnerable walls, and is downstream piping designed for the resulting velocity or two-phase flow? |
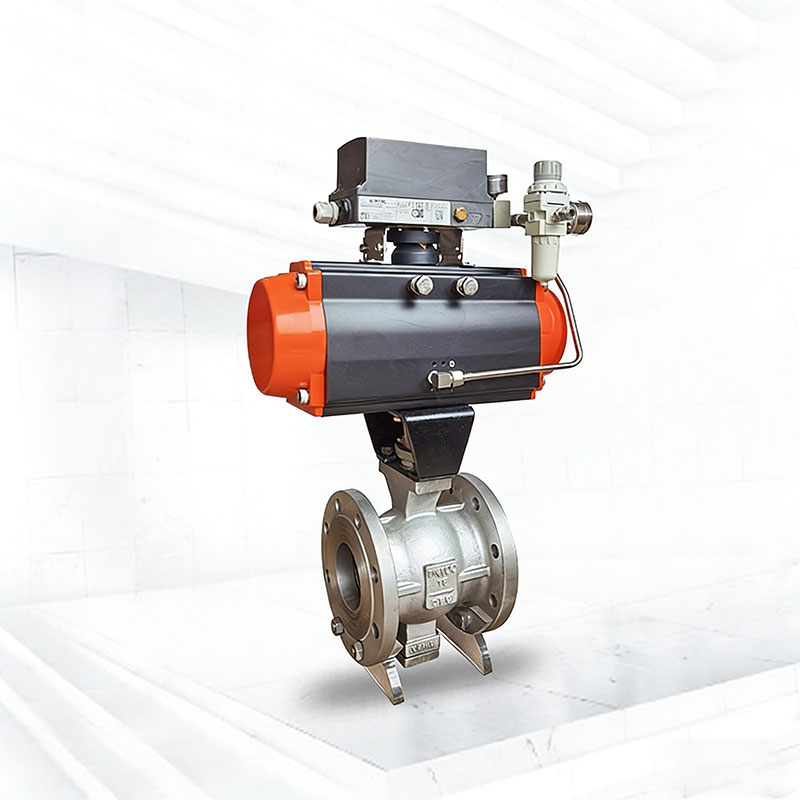
A pneumatic V-port control ball valve may be attractive for capacity and modulating range, while an eccentric rotary valve may suit another compact throttling duty. Neither link is a blanket recommendation for control valve cavitation. Valve-specific sizing and the actual process window decide suitability.
Start with the application, then compare appropriate control valve options rather than choosing an architecture by nominal line size alone.
The Data Needed for an Accurate Control Valve Cavitation Review
A strong request for quotation lets an engineer evaluate capacity, controllability, control valve cavitation, flashing, noise, materials, and actuator margin together. Supply values as simultaneous operating cases rather than combining unrelated extremes.
| Data group | Information to provide |
| Fluid | Chemical name and composition, liquid phase, solids content and particle size, corrosive or toxic properties |
| Thermodynamics | Density or specific gravity, viscosity, vapor pressure, critical pressure if available, and temperature for each case |
| Operating cases | Minimum, normal, and maximum flow with corresponding P1, P2, and temperature; startup, shutdown, cleaning, and upset cases |
| Pressure basis | Clearly identify gauge or absolute pressure and include atmospheric pressure where conversion is needed |
| Piping | Upstream and downstream nominal size, schedule or inside diameter, reducers, expanders, nearby elbows, and available straight run |
| Valve duty | Throttling objective, required rangeability, expected travel, shutoff class, flow direction, duty cycle, and acceptable leakage |
| Actuation | Pneumatic or electric preference, available supply or power, control signal, fail action, stroking requirements, and accessories |
| Design requirements | Design pressure and temperature, materials, end connections, applicable codes, hazardous-area needs, inspection, testing, and documentation |
| Reliability limits | Allowable noise, vibration concerns, target service interval, criticality, and history of previous damage |
Include photographs of the installation and damaged components, process trends around the event, and the existing valve datasheet when available. The team can then compare changes to the system, trim, valve body, actuation, and piping as one solution. Phileda’s industrial valve solutions page provides additional application context.
A Practical Seven-Step Troubleshooting Workflow
Use this sequence before ordering a like-for-like replacement:
- Verify the measurements. Confirm pressure-transmitter range, impulse-line condition, temperature accuracy, units, and whether pressures are gauge or absolute.
- Define simultaneous cases. Build normal, minimum, maximum, startup, and upset cases from time-aligned data.
- Classify the phase behavior. Compare the minimum local-pressure prediction and recovered P2 with the correct temperature-dependent Pv to distinguish control valve cavitation from flashing.
- Check installed sizing. Recalculate required capacity, expected travel, liquid velocity, choked-flow condition, noise, valve recovery, and fitting effects for each case.
- Match the evidence. Compare the predicted condition with sound, vibration, control trends, and the mapped damage pattern.
- Evaluate solutions in hierarchy order. Model process changes, staged pressure reduction, alternative flow paths, outlet or piping changes, and materials. Check plugging risk and actuator margin.
- Validate after commissioning. Confirm travel and loop response, record a noise and vibration baseline, inspect for leakage, and schedule condition-based follow-up.
This workflow prevents a common failure: solving a flashing problem with trim intended for control valve cavitation, or installing erosion-resistant trim while the damaging collapse zone remains against the body wall.
Common Fixes That Often Fail
“Use a larger valve”
A larger body may reduce velocity in one region, but excessive capacity can push normal operation toward the seat. Size the valve for the full installed range and verify travel, recovery, and noise; do not use line size as the valve size.
“Use harder trim”
Harder material can slow erosion. It cannot stop the pressure from falling below Pv, so untreated control valve cavitation continues to generate shock loading and may move damage to the body or downstream pipe.
“The outlet pressure is above vapor pressure, so vapor cannot form”
P2 is not Pvc. The local minimum inside the valve may be much lower than the downstream gauge pressure. In fact, recovery above Pv after a lower Pvc is the condition that causes bubble collapse.
“If it is noisy, it must be control valve cavitation”
Noise can come from turbulent liquid flow, flashing, gas expansion, pipe resonance, or mechanical looseness. Diagnose the pressure-temperature condition and then use sound as supporting evidence.
“A trim for control valve cavitation also eliminates flashing”
When P2 remains below Pv, the vapor cannot fully condense downstream. A design intended to prevent collapse may not address sustained two-phase velocity or downstream erosion. Flashing must be treated as a two-phase system problem.
FAQ
What causes control valve cavitation?
Control valve cavitation occurs when local pressure near the valve restriction falls below the liquid’s vapor pressure, forming vapor bubbles, and then recovers above vapor pressure downstream, causing those bubbles to collapse. A high pressure drop, elevated liquid temperature, high-recovery flow path, or unfavorable operating position can increase the risk.
What is the difference between cavitation and flashing in a control valve?
Both begin with local vapor formation. In control valve cavitation, recovered downstream pressure exceeds vapor pressure and the bubbles collapse. In flashing, downstream pressure remains at or below vapor pressure, so vapor persists into the outlet piping.
How can control valve cavitation be prevented?
Prioritize keeping local pressure above vapor pressure or reducing the energy of bubble collapse. Depending on the process, that may mean changing P1, P2, or temperature; splitting the pressure drop; using multi-stage or multi-path trim; choosing a lower-recovery flow path; relocating the collapse zone; and selecting resistant materials for residual exposure.
Can control valve cavitation occur when downstream pressure is above vapor pressure?
Yes. That is central to control valve cavitation: Pvc can fall below Pv even when measured P2 is above Pv. Vapor forms at the local minimum and collapses as pressure recovers toward P2.
Does a larger control valve reduce control valve cavitation?
Not automatically. It may reduce some velocities but can also operate at low travel, reduce control resolution, and create a concentrated jet. Recalculate the full installed operating range before changing valve size.
Can gases cavitate in a control valve?
Cavitation is a liquid phenomenon involving vapor cavities. Gas service can experience aerodynamic noise, high velocity, vibration, and choked flow, but these should not be diagnosed as control valve cavitation.
Is hardened trim enough for severe control valve cavitation?
Usually not by itself. Hardened trim resists damage; it does not change the underlying pressure profile. The engineering review should first reduce vapor formation or bubble-collapse energy, then select materials for the remaining exposure.
What information should I send to a valve manufacturer?
Send fluid composition and properties, minimum/normal/maximum flow, corresponding inlet and outlet pressures, temperature and vapor pressure for each case, piping details, required shutoff and actuation, applicable standards, noise limit, and any damage history. Do not send independent maximum values as though they occur simultaneously unless they truly do.
Conclusion
The fastest way to stop recurring control valve cavitation damage is to diagnose the phase behavior before choosing the hardware. Track pressure from P1 through the hidden minimum at the vena contracta to P2, compare it with the correct Pv, and confirm the conclusion with synchronized operating data and mapped inspection evidence. If vapor collapses after recovery, manage control valve cavitation. If it remains vapor downstream, design for flashing and persistent two-phase flow.
Then apply solutions in the right order: improve the process pressure profile, distribute the pressure drop, control the recovery and jet path, protect vulnerable materials, and monitor the result. That approach improves reliability more effectively than repeatedly installing a larger valve or harder trim without correcting the cause.
For an application-specific review, contact Phileda with the operating-case data checklist above. A complete dataset makes it possible to evaluate valve size, trim, body style, actuator, materials, and downstream conditions as one engineered system.