A control valve can have enough capacity for the maximum flow and still be difficult to control during normal operation. One reason is the relationship between valve travel and flow capacity. Selecting the right control valve flow characteristic helps engineers match valve response to the process across its working range.
This article continues the selection sequence covered in our control valve sizing guide. Once the required capacity has been calculated, the next question is how that capacity should change as the valve opens.
Table of Contents
What Are Control Valve Flow Characteristics?
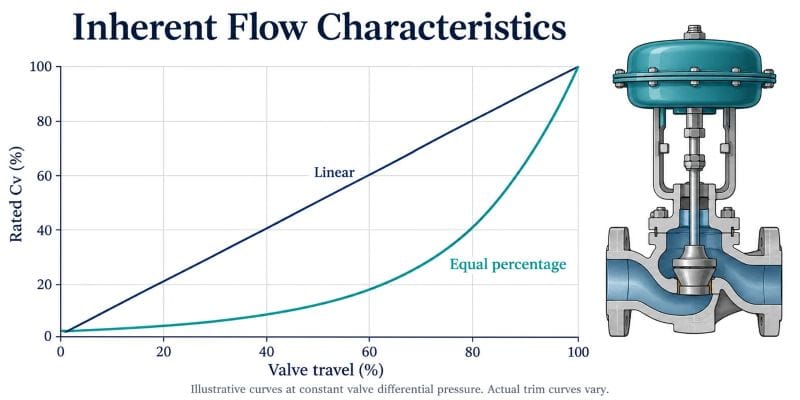
A flow characteristic describes how valve capacity changes with travel. Engineers distinguish between the inherent characteristic, measured with a constant pressure difference across the valve, and the installed characteristic, which reflects the actual piping system.
Those curves can differ. Pumps, pipe friction and other equipment affect the pressure available across the valve as operating conditions change. A trim curve alone therefore cannot establish the final process response. Valmet explains this distinction in its control valve installed performance guide.
Equal Percentage vs Linear: What Is the Difference?
| Characteristic | Capacity response at constant differential pressure | Selection question |
|---|---|---|
| Linear | Equal travel increments produce approximately equal changes in flow coefficient within the characterized range. | Does the installed system preserve a useful, reasonably uniform response? |
| Equal percentage | Equal travel increments produce approximately equal percentage changes in flow coefficient within the characterized range. | Does this curve provide suitable response over the required operating range? |
| Quick opening | A relatively large share of capacity becomes available early in the opening stroke. | Is rapid opening or switching the intended duty? |
These are descriptions of characteristic shapes, rather than guarantees of installed flow. The actual curve and usable travel range should come from the selected valve’s data.
Linear Control Valve Characteristics
With a linear inherent characteristic, the change in capacity per unit of travel is approximately constant. This makes the curve straightforward to interpret, but it does not mean that 50% travel will always produce 50% of the installed maximum flow.
Review the pressure difference across the valve at each operating case before specifying linear trim. If that pressure difference varies substantially, the installed response may depart from the catalog curve.
Equal Percentage Control Valve Characteristics
An equal percentage characteristic provides smaller absolute capacity changes at the lower end of its characterized range and larger changes toward the upper end. It should be evaluated together with the system pressure profile, rather than selected simply because the application needs a wide flow range.
For an idealized example, a 20% capacity increase takes a coefficient of 10 to 12, while the same percentage increase takes 50 to 60. These figures illustrate percentage change only; they are not a manufacturer’s travel curve or a sizing calculation.
Why the Installed Characteristic Matters
The control system responds to the installed valve and process together. A useful review examines the full path from controller output to valve travel, flow and the controlled variable.
For example, a valve may show smooth movement while the process response becomes much more sensitive in one part of the operating range. Investigating the installed curve can help separate a selection issue from controller tuning, actuator friction or positioner configuration. Emerson’s flow characteristics webinar discusses sizing, inherent and installed gain, and characteristic selection together.
A Practical Selection Workflow
1. Define Minimum, Normal and Maximum Conditions
Provide flow, inlet pressure, outlet pressure, temperature and fluid properties for each case. Include startup or alternative operating modes where they affect the valve’s required performance. Keep pressure units and absolute versus gauge pressure clearly identified.
2. Complete the Capacity Calculation
Calculate the required flow coefficient for each case using a method appropriate to the fluid and service. Do not use a simplified liquid calculation for steam or gas. Evaluate flashing, cavitation, choking and noise where relevant.
The Cv and pressure drop guide provides the preceding step in this selection sequence.
3. Compare Candidate Curves
Ask the supplier to identify the expected travel at each operating point for the proposed valve and trim. Compare how much useful adjustment remains around normal operation and how the valve responds near minimum demand.
Avoid imposing one universal preferred travel band on every valve style. Use the manufacturer’s characterized range and the application’s control requirements.
4. Review the Complete Assembly
Confirm actuator sizing, fail action, available air or electrical supply, positioner settings and response requirements. Characteristic selection and actuator selection answer different questions, but both affect the delivered control response. Our electric vs pneumatic control valve guide covers the actuator decision.
5. Document the Accepted Selection
Record the selected curve, rated capacity, operating cases, predicted travel and positioner configuration. This gives commissioning and maintenance teams a clear basis for checking the installed assembly.
Common Selection Mistakes
- Specifying only line size and pressure class, without operating flow and pressure cases.
- Assuming a linear inherent curve guarantees linear installed flow.
- Treating equal percentage trim as a solution to every low-flow control problem.
- Adding capacity margins repeatedly without checking the resulting normal operating travel.
- Changing controller tuning before checking valve movement and positioner configuration.
What Should Buyers Include in an RFQ?
An RFQ should include the fluid, composition where relevant, minimum/normal/maximum flow, corresponding pressures and temperatures, connection requirements, materials, shutoff requirements, actuator utilities and fail action.
Ask for the proposed characteristic curve and operating-point calculation, rather than accepting a description such as “good regulating performance.” If several trims are offered, request a comparison using the same process cases.
For a Phileda project inquiry, provide the operating cases with the requested valve size and actuator preference so that the proposed assembly can be evaluated against the actual duty. Product-specific capacity, materials and performance should be confirmed in the supplier’s quotation and technical documents.
FAQ
Is equal percentage always better than linear?
No. The choice depends on the installed system, operating range and required process response. Compare candidate curves against the same operating cases.
Does 50% valve opening mean 50% flow?
Not necessarily. The result depends on the valve’s characteristic and the pressure conditions in the system.
Can changing the characteristic fix an oversized valve?
A different curve may change response, but capacity and operating travel still need to be checked. Review the size and trim before treating characteristic changes as the remedy.
Does actuator type determine the flow characteristic?
The valve’s inherent characteristic and the assembly’s command-to-travel behavior are separate factors. Confirm the valve curve and actuator/positioner configuration individually.
Choose the Curve With the Operating Cases
Specify control valve flow characteristics after reviewing capacity, pressure conditions and useful travel across the operating range. A documented comparison gives engineers and buyers a stronger basis for selection than a trim label alone.